|
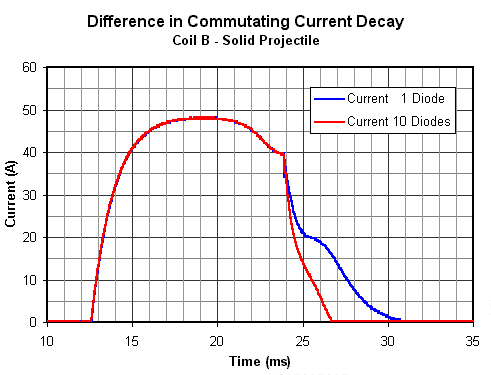
Diode Commutation Results Coil B The graph of fig1 shows the difference in the commutating current decay for 1 diode and 10 diodes.
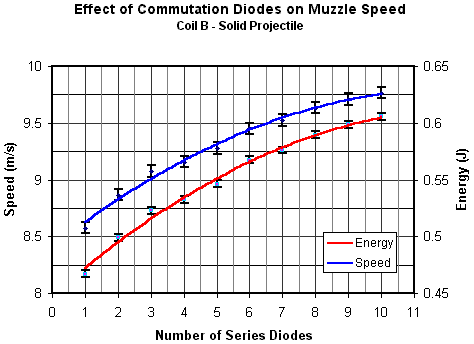
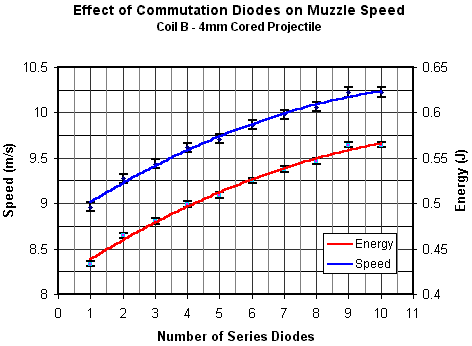
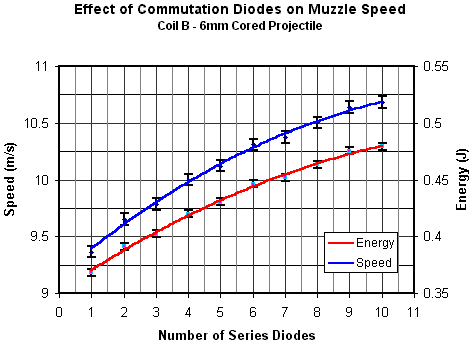
Fig1. Difference in commutating current decay. In this case the decay time for 10 diodes is less than half that of 1 diode. The following graphs show the effect of the commutating diode arrangement on the muzzle speed and energy. Five speed measurements were made for each diode arrangement. The data points on the graphs represent the average of the five readings.
Fig2. Muzzle speed gain using multiple series diodes
Fig3. Muzzle speed gain using multiple series diodes
Fig4. Muzzle speed gain using multiple series diodes
Table 1 shows the gain in velocity and energy using 10 diodes instead of 1.
Table 1. Gains in speed and energy using multiple series diodes.
Interestingly the increase in energy is greater with coil B compared to coil A.
|
|


