|
Optical Triggering Results Coil C Table 1 shows the resulting speeds for each projectile type.
Table 1. Comparison of maximum open loop speed and optical speed.
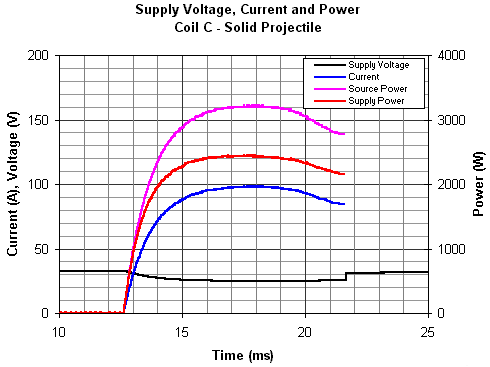
In this case we can see that the optical speeds remain close to the optimal open loop results. There appears to be a bit more variation in the speed differences in this case. The reason for this is unknown. The current, voltage and power curves are shown in fig 1.
Fig 1. Voltage, current and power curves.
The peak current demand is now 100A and the corresponding peak source internal loss has reached about 800W.
Table 2. Efficiency comparisons for solid projectile.
The gap between the coilgun and overall efficiencies has increased over those for coil B.
|
|


